| American Obesity Rates
The Health eZine - Eating Disorders
Obesity Rates Continue to
|
||||||||||||||||||||||||||||||||||||||||||||||||||||||||||||||||||||||||||||||||||||||||||||||||||||||||||||||||||||||||||||||||||||||||||||||||||||||||||||||||||||||||||||||||||||||||||||||||||||||||||||||||||||||||||||||||||||||||||||||||||||||||||||||||||||||||||||||||||||||||||||||||||||||||||||||||||||||||||||||||||||||||||||||||||||||||||||||||||||||||||||||||||||||||||||||||||||||||||||||||||||||||||||||||||||||||||||
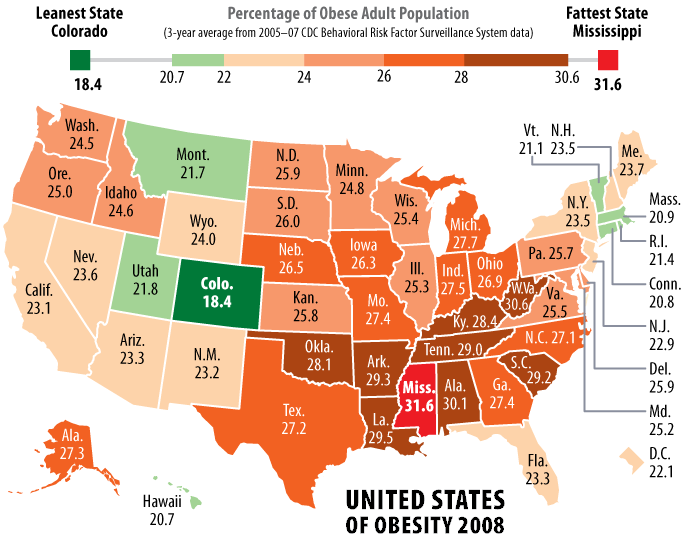
United States of Obesity: Fattest States 2008 |
|||||||
| 2007 Rank |
2008 Rank |
State | % Obese 2007 |
% Obese or Overweight 2007 |
3-year Obesity Average |
% Obesity Change |
Ranking Change |
|---|---|---|---|---|---|---|---|
| 1 | 1 | Mississippi | 32.6 | 68.1 | 31.6 | 1.0 | 0 |
| 2 | 2 | West Virginia | 30.3 | 68.0 | 30.6 | 0.9 | 0 |
| 3 | 3 | Alabama | 30.9 | 66.6 | 30.1 | 0.7 | 0 |
| 4 | 4 | Louisiana | 30.7 | 65.2 | 29.5 | 1.3 | 0 |
| 5 | 5 | South Carolina | 29.0 | 65.3 | 29.2 | 1.3 | 0 |
| 6 | 6 | Tennessee | 30.7 | 67.4 | 29.0 | 1.2 | 0 |
| 7 | 7 | Kentucky | 28.7 | 69.1 | 28.4 | 1.0 | 0 |
| 9 | 8 | Oklahoma | 28.8 | 65.1 | 28.1 | 1.3 | 1 |
| 8 | Arkansas | 29.3 | 65.6 | 28.1 | 1.1 | 0 | |
| 9 | 10 | Michigan | 28.2 | 64.3 | 27.7 | 0.9 | -1 |
| 9 | 11 | Indiana | 27.4 | 63.2 | 27.5 | 0.6 | -2 |
| 14 | 12 | Georgia | 28.7 | 65.0 | 27.4 | 1.3 | 2 |
| 12 | Missouri | 28.2 | 63.3 | 27.4 | 1.1 | 0 | |
| 16 | 14 | Alaska | 28.2 | 65.1 | 27.3 | 1.5 | 2 |
| 12 | 15 | Texas | 28.6 | 65.8 | 27.2 | 0.9 | -3 |
| 17 | 16 | North Carolina | 28.7 | 64.6 | 27.1 | 1.5 | 1 |
| 15 | 17 | Ohio | 28.1 | 63.5 | 26.9 | 0.9 | -2 |
| 18 | 18 | Nebraska | 26.5 | 64.7 | 26.5 | 1.1 | 0 |
| 20 | 19 | Iowa | 27.7 | 64.7 | 26.3 | 1.4 | 1 |
| 20 | 20 | South Dakota | 27.2 | 65.5 | 26.0 | 1.1 | 0 |
| 19 | 21 | North Dakota | 27.0 | 64.9 | 25.9 | 0.8 | -2 |
| 29 | Delaware | 28.2 | 65.0 | 25.9 | 2.4 | 8 | |
| 27 | 23 | Kansas | 27.7 | 63.8 | 25.8 | 1.5 | 4 |
| 23 | 24 | Pennsylvania | 27.8 | 62.7 | 25.7 | 1.2 | -1 |
| 24 | 25 | Virginia | 26.3 | 62.9 | 25.5 | 1.1 | -1 |
| 22 | 26 | Wisconsin | 25.3 | 62.3 | 25.4 | 0.7 | -4 |
| 24 | 27 | Illinois | 25.6 | 63.0 | 25.3 | 0.9 | -3 |
| 24 | 28 | Maryland | 26.3 | 62.7 | 25.2 | 0.8 | -4 |
| 30 | 29 | Oregon | 26.3 | 62.0 | 25.0 | 1.7 | 1 |
| 28 | 30 | Minnesota | 26.0 | 62.0 | 24.8 | 1.1 | -2 |
| 32 | 31 | Idaho | 25.1 | 63.1 | 24.6 | 1.4 | 1 |
| 31 | 32 | Washington | 25.9 | 62.1 | 24.5 | 1.2 | -1 |
| 35 | 33 | Wyoming | 24.5 | 62.2 | 24.0 | 1.2 | 2 |
| 32 | 34 | Maine | 25.2 | 62.9 | 23.7 | 0.6 | -2 |
| 37 | 35 | Nevada | 24.6 | 63.0 | 23.6 | 1.2 | 2 |
| 37 | 36 | New York | 25.5 | 61.9 | 23.5 | 1.1 | 1 |
| 37 | New Hampshire | 25.1 | 61.8 | 23.5 | 1.2 | 1 | |
| 34 | 38 | Florida | 24.1 | 62.1 | 23.3 | 0.4 | -4 |
| 43 | Arizona | 25.8 | 62.6 | 23.3 | 1.5 | 5 | |
| 42 | 40 | New Mexico | 25.1 | 60.8 | 23.2 | 1.2 | 2 |
| 36 | 41 | California | 23.3 | 59.0 | 23.1 | 0.4 | -5 |
| 40 | 42 | New Jersey | 24.1 | 62.3 | 22.9 | 0.7 | -2 |
| 40 | 43 | District of Columbia | 22.2 | 55.3 | 22.1 | -0.1 | -3 |
| 44 | 44 | Utah | 22.4 | 58.0 | 21.8 | 0.7 | 0 |
| 45 | 45 | Montana | 22.6 | 61.8 | 21.7 | 1.0 | 0 |
| 46 | 46 | Rhode Island | 21.7 | 60.8 | 21.4 | 0.9 | 0 |
| 48 | 47 | Vermont | 21.9 | 58.8 | 21.1 | 1.1 | 1 |
| 49 | 48 | Massachusetts | 21.7 | 58.9 | 20.9 | 1.1 | 1 |
| 47 | 49 | Connecticut | 21.7 | 59.2 | 20.8 | 0.7 | -2 |
| N.A. | 50 | Hawaii | 21.7 | 56.8 | 20.7 | N.A. | N.A. |
| 50 | 51 | Colorado | 19.3 | 55.7 | 18.4 | 0.8 | -1 |
| Obesity is defined as a BMI of 30.0 or over, overweight as a BMI of 25.0 to 29.9. | |||||||


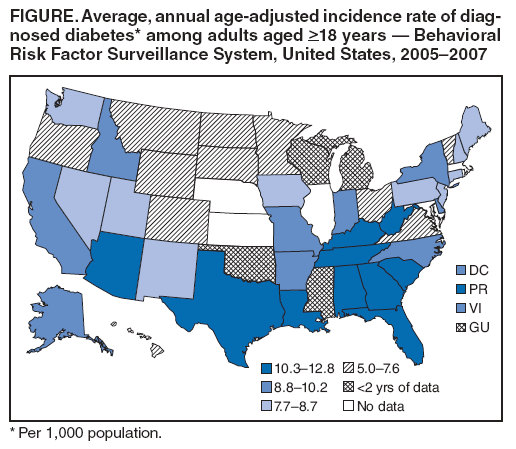
Obesity blamed for doubling rate of diabetes cases
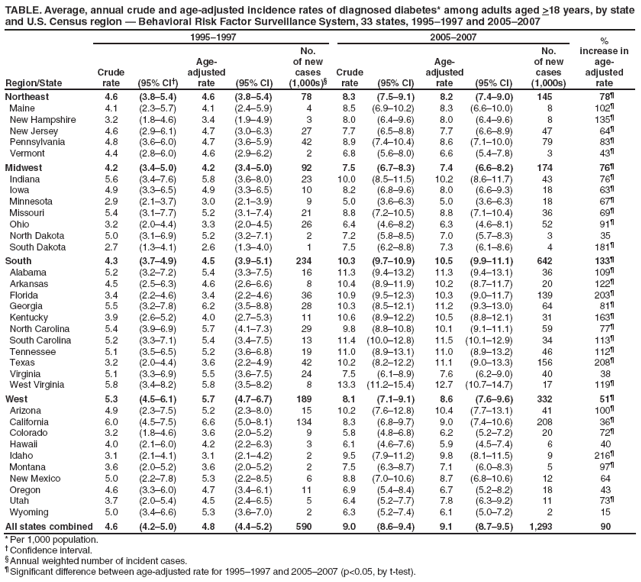
The nation's obesity epidemic is exacting a heavy toll: The rate of new diabetes cases nearly doubled in the United States in the past 10 years, the government said Thursday. The highest rates were in the South, according to the first state-by-state review of new diagnoses. The worst was in West Virginia, where about 13 in 1,000 adults were diagnosed with the disease in 2005-07. The lowest was in Minnesota, where the rate was 5 in 1,000.
Nationally, the rate of new cases climbed from about 5 per 1,000 in the mid-1990s to 9 per 1,000 in the middle of this decade.
Roughly 90 percent of cases are Type 2 diabetes, the form linked to obesity.
The findings dovetail with trends seen in obesity and lack of exercise — two health measures where Southern states also rank at the bottom.
"It isn't surprising the problem is heaviest in the South — no pun intended," agreed Matt Petersen, who oversees data and statistics for the American Diabetes Association.
The study, led by Karen Kirtland of the Centers for Disease Control and Prevention, provides an up-to-date picture of where the disease is exploding. The information should be a big help as the government and health insurance companies decide where to focus prevention campaigns, Petersen said.
Diabetes was the nation's seventh-leading cause of death in 2006, according to the CDC. More than 23 million Americans have diabetes, and the number is rapidly growing. About 1.6 million new cases were diagnosed among adults last year.
In Type 2 diabetes, cells do not properly use insulin, a hormone needed to convert sugar into energy, and the pancreas gradually loses its ability to produce it. The illness can cause sugar to build up in the body, leading to complications such as heart disease, blindness, kidney failure and poor circulation that leads to foot amputations.
The study involved a random-digit-dialed survey of more than 260,000 adults. Participants were asked if they had ever been told by a doctor that they have diabetes, and when the diagnosis was made. The comparisons between 1995-97 and 2005-07 covered only the 33 states for which the CDC had complete data for both time periods.
The researchers had data for 40 states for the years 2005-07.
West Virginia, South Carolina, Alabama, Georgia, Texas and Tennessee had the highest rates, all at 11 cases per 1,000 or higher. Puerto Rico was about as high as West Virginia. Minnesota, Hawaii and Wyoming had the lowest rates.
It is not entirely clear why some states were worse than others. Older people, blacks and Hispanics tend to have higher rates of Type 2 diabetes, and the South has large concentrations of all three groups. However, West Virginia is overwhelmingly white.
The report asked about diagnosed diabetes only. Because an estimated one in four diabetics have not been diagnosed, the findings probably underestimate the problem, said Angela Liese, a diabetes researcher at the University of South Carolina.
The underestimates may be particularly bad in the rural South and other areas where patients have trouble getting health care, she noted.
Dieting & Eating Disorders
Anorexia Vs Obesity in North America
Lose Weight Canada, Get Lower Taxes
i'm fat and lovin' it - McDonalds and Obesity
Obese Shoppers Are Discriminated in Stores: Study
Skinny Fashion Models and Standardized Women's Clothing Sizes
